Skip to content

Version v3.7.0 of the documentation is no longer actively maintained. The site that you are currently viewing is an archived snapshot. For up-to-date documentation, see the latest version.

Observability Infra

Modern observability stack with 3000+ metrics, 30+ dashboards, and enterprise-grade monitoring

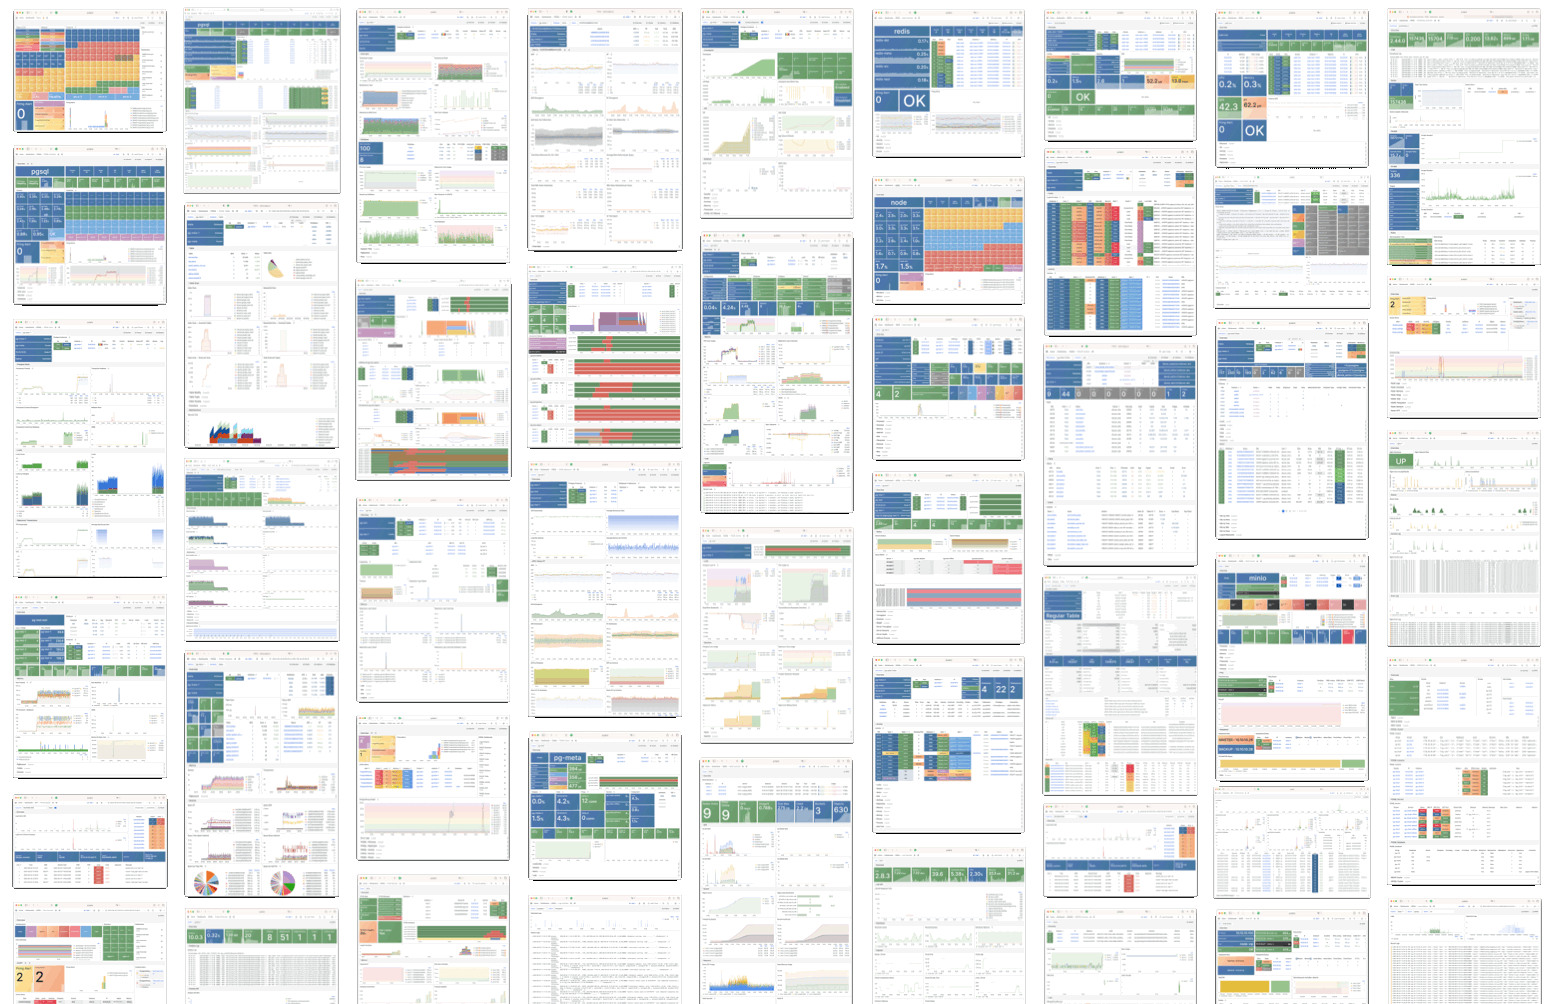
Pigsty delivers unparalleled observability with a modern monitoring stack built on industry best practices. Automatically monitor every component with 3000+ metrics, 30+ dashboards.

Note

Complete Insight: Monitor everything from high-level cluster health to individual table statistics. Get complete insight into the past, present, and future of your infrastructure.

Architecture Overview

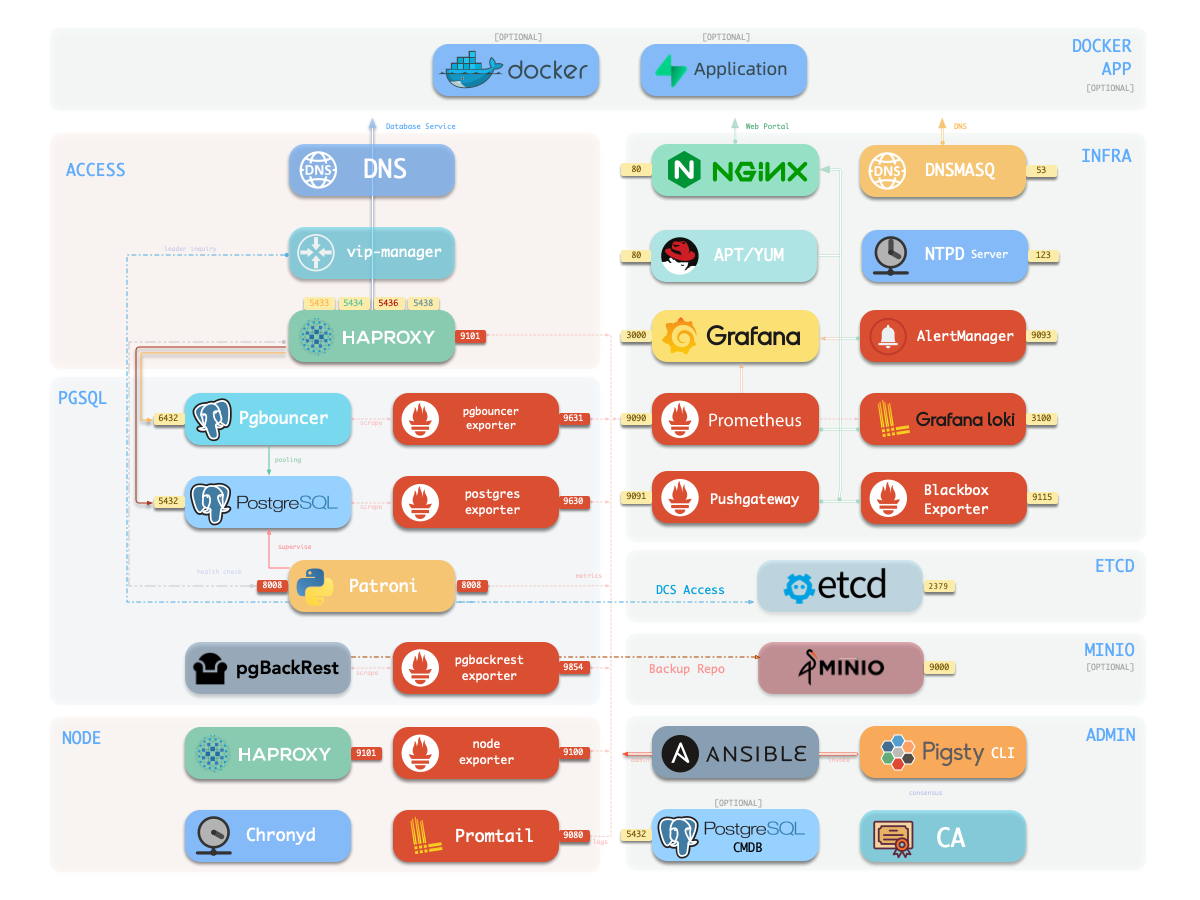
Pigsty’s observability infrastructure leverages battle-tested open-source components in a cohesive, production-ready stack:

Grafana Visualization Engine

Dashboards with advanced interactive visualizations

Prometheus Metrics Database

Time-series storage with powerful query language

Loki Logging Platform

Centralized logging with label-based indexing

AlertManager

Alert aggregate, management and escalation

Service Architecture


Monitoring Dashboards

Multi-Level Dashboard Hierarchy

Pigsty provides 26+ PostgreSQL dashboards organized in a logical drill-down hierarchy:

# Global overview dashboards
dashboards:
  - Home: Global cluster overview and key metrics
  - INFRA: Infrastructure services status
  - NODES: Node-level resource utilization
  - Alert: Active alerts and notification status

Purpose: High-level operational visibility across entire environment Audience: Operations teams, management dashboards

# Cluster-focused dashboards
dashboards:
  - PGSQL Cluster: Cluster health and replication status
  - PGSQL Service: Service endpoints and load balancing
  - PGSQL Activity: Connection pools and query activity
  - PGSQL Replication: Streaming replication metrics

Purpose: Cluster-wide PostgreSQL performance and health Audience: Database administrators, SRE teams

# Instance-specific dashboards
dashboards:
  - PGSQL Instance: Detailed PostgreSQL server metrics
  - PGSQL Persist: WAL, checkpoints, and persistence
  - PGSQL Proxy: Pgbouncer connection pooling metrics
  - PGSQL Session: Active sessions and lock analysis

Purpose: Deep-dive into individual PostgreSQL instances Audience: Database developers, performance engineers

# Database and object-level dashboards
dashboards:
  - PGSQL Database: Database-specific performance metrics
  - PGSQL Table: Table statistics and access patterns
  - PGSQL Query: Query performance and optimization
  - PGSQL Slow: Slow query analysis and tuning

Purpose: Application-level database performance analysis Audience: Application developers, database analysts

Dashboard Features

Drill-Down Navigation

Seamless exploration from overview to granular details with contextual linking

Time Range Controls

Flexible time windows from real-time to historical analysis over months

Multi-Dimensional Filtering

Dynamic filtering by cluster, instance, database, or custom labels

Alert Integration

Visual alert correlation with metrics and direct links to alert details


Grafana Deployment

Enhanced Grafana Stack

Pigsty extends Grafana with powerful plugins and data sources for advanced analytics:

# Essential Grafana plugins
grafana_plugins:
  - grafana-piechart-panel        # Pie chart visualizations
  - grafana-polystat-panel        # Multi-value status panels
  - grafana-worldmap-panel        # Geographic visualizations
  - grafana-clock-panel           # Time display widgets

Purpose: Essential visualization capabilities for monitoring dashboards

# Advanced visualization plugins
grafana_plugins:
  - echarts-panel                 # Apache ECharts integration
  - volkovlabs-echarts-panel      # Enhanced ECharts support
  - volkovlabs-form-panel         # Interactive forms
  - volkovlabs-variable-panel     # Dynamic variables

Purpose: Rich, interactive visualizations for complex data analysis

# Extended data source support
grafana_datasources:
  - infinity-datasource           # REST API and file data sources
  - redis-datasource              # Redis data source
  - clickhouse-datasource         # ClickHouse integration
  - postgres-datasource           # Enhanced PostgreSQL support

Purpose: Connect to diverse data sources beyond traditional metrics

# Pigsty-specific customizations
custom_features:
  - pigsty-theme                  # Custom branding and colors
  - dashboard-provisioning       # Automated dashboard deployment
  - alert-templates               # Pre-configured alert rules
  - data-link-automation          # Context-aware navigation

Purpose: Tailored user experience optimized for PostgreSQL environments

Configuration & Customization

# Advanced Grafana configuration
grafana_config:
  # Authentication
  auth.anonymous.enabled: true
  auth.anonymous.org_role: Viewer
  auth.disable_login_form: false

  # Security
  security.allow_embedding: true
  security.cookie_secure: true
  security.cookie_samesite: strict

  # Performance
  database.max_open_conn: 300
  database.max_idle_conn: 300
  database.conn_max_lifetime: 14400

  # Alerting
  alerting.enabled: true
  alerting.execute_alerts: true
  unified_alerting.enabled: true

  # Custom panels
  panels.enable_alpha: true
  feature_toggles.enable: ngalert,live,publicDashboards

Prometheus Stack

Complete Monitoring Ecosystem

Pigsty deploys the full Prometheus ecosystem for comprehensive observability:

Step 1

Prometheus Server

Core metrics database with advanced querying and storage capabilities

# Prometheus configuration highlights
prometheus_config:
  global:
    scrape_interval: 15s          # Default scrape frequency
    evaluation_interval: 15s      # Rule evaluation frequency
    external_labels:
      cluster: '{{ pg_cluster }}'

  rule_files:
    - "/etc/prometheus/rules/*.yml"

  scrape_configs:
    - job_name: 'node'            # Node-level metrics
    - job_name: 'postgres'        # PostgreSQL metrics
    - job_name: 'redis'           # Redis metrics
    - job_name: 'pushgateway'     # Batch job metrics

Step 2

AlertManager

Intelligent alert routing with suppression, grouping, and escalation

# AlertManager routing configuration
alertmanager_routes:
  - match:
      severity: critical
    receiver: pagerduty-critical
    group_wait: 30s
    group_interval: 5m
    repeat_interval: 4h

  - match:
      severity: warning
    receiver: slack-warnings
    group_wait: 1m
    group_interval: 10m
    repeat_interval: 24h

Step 3

Pushgateway

Batch job metrics collection for ephemeral workloads and cron jobs

# Example: Backup job metrics
echo "backup_duration_seconds $(date +%s)" | curl --data-binary @- \
  http://pushgateway:9091/metrics/job/pg-backup/instance/pg-test

Step 4

Blackbox Exporter

Network connectivity monitoring with HTTP, TCP, and ICMP probes

# Blackbox probe configuration
blackbox_probes:
  http_2xx:
    prober: http
    timeout: 5s
    http:
      valid_status_codes: [200]

  tcp_connect:
    prober: tcp
    timeout: 5s

Pre-configured Alert Rules

# Sample PostgreSQL alert rules
alert_rules:
  - alert: PostgreSQLDown
    expr: pg_up == 0
    for: 5m
    labels:
      severity: critical
    annotations:
      summary: "PostgreSQL instance {{ $labels.instance }} is down"

  - alert: PostgreSQLHighConnections
    expr: pg_stat_database_numbackends / pg_settings_max_connections > 0.8
    for: 10m
    labels:
      severity: warning
    annotations:
      summary: "High connection usage on {{ $labels.instance }}"

  - alert: PostgreSQLReplicationLag
    expr: pg_replication_lag_seconds > 300
    for: 5m
    labels:
      severity: warning
    annotations:
      summary: "Replication lag > 5 minutes on {{ $labels.instance }}"

pg_exporter: Advanced PostgreSQL Monitoring

Custom Metrics Engine

Pigsty’s pg_exporter is a highly customizable PostgreSQL metrics collector supporting all PostgreSQL versions with fine-grained metric control:

# pg_exporter key capabilities
features:
  - auto_discovery: true          # Automatic database discovery
  - custom_queries: true          # User-defined metric queries
  - version_aware: true           # PostgreSQL version detection
  - rds_compatible: true          # Cloud database support
  - label_customization: true     # Flexible metric labeling
  - connection_pooling: true      # Efficient connection reuse

Advantages: Flexible, lightweight, and highly configurable

# PostgreSQL version support matrix
supported_versions:
  - postgresql_9_6: legacy_metrics_set
  - postgresql_10: enhanced_metrics_set
  - postgresql_11: advanced_metrics_set
  - postgresql_12: modern_metrics_set
  - postgresql_13: extended_metrics_set
  - postgresql_14: latest_metrics_set
  - postgresql_15: cutting_edge_metrics_set
  - postgresql_16: next_gen_metrics_set

Benefit: Single exporter for heterogeneous PostgreSQL environments

# Custom metric definition example
custom_queries:
  pg_custom_business_metrics:
    query: |
      SELECT
        schemaname,
        tablename,
        n_tup_ins as inserts_total,
        n_tup_upd as updates_total,
        n_tup_del as deletes_total
      FROM pg_stat_user_tables
    metrics:
      - inserts_total:
          usage: COUNTER
          description: "Total number of inserts"
      - updates_total:
          usage: COUNTER
          description: "Total number of updates"
# RDS monitoring configuration
rds_monitoring:
  connection_string: "postgres://monitor:[email protected]:5432/postgres"
  metrics_subset: rds_safe        # RDS-compatible metrics only
  auto_discovery: false           # Manual database specification
  query_timeout: 30s              # Conservative timeout

  # RDS-specific metrics
  included_databases: [production, staging]
  excluded_schemas: [information_schema, pg_catalog]

Metrics Configuration

# Comprehensive pg_exporter configuration
pg_exporter_config:
  # Connection settings
  data_source_name: "postgres://dbuser_monitor:password@localhost:5432/postgres"

  # Metric collection
  auto_discover_databases: true
  exclude_databases: [template0, template1]
  include_databases: [postgres, business_db]

  # Query customization
  query_path: "/etc/pg_exporter/queries"
  metric_prefix: "pg"

  # Performance tuning
  parallel_scrape: true
  scrape_timeout: 30s
  max_connections: 3

  # Security
  ssl_mode: require
  ssl_cert: "/etc/ssl/pg-client.crt"
  ssl_key: "/etc/ssl/pg-client.key"

Host & Infrastructure Monitoring

Pigsty v3.7 installs node_exporter on managed nodes and registers Node, HAProxy, Keepalived, Nginx, Etcd, MinIO, Redis, PostgreSQL, PgBouncer, and pgBackRest targets with Prometheus when the corresponding modules are enabled. Component ports and switches are defined by the tagged role defaults and documented on each module’s parameter page.

External Database Monitoring

Existing PostgreSQL instances and cloud RDS can be registered with pgsql-monitor.yml. Supply a monitor connection URL with only the required pg_monitor privileges; Pigsty registers pg_exporter and the Grafana datasource without provisioning or changing that database.

./pgsql-monitor.yml -e pg_exporters='{"rds":{"pg_exporter_url":"postgres://dbuser_monitor:[email protected]:5432/postgres"}}'

Data Analytics & Visualization Platform

Grafana can query both Prometheus metrics and PostgreSQL data. The bundled dashboards use variables and URL links for drill-down navigation; ECharts and other packaged plugins can visualize application or business data.

Low-Code Application Development

Grafana panels may be combined with PostgreSQL queries to build internal operational views. This is a visualization capability, not a separate Pigsty deployment module or application API.

Reusable Infrastructure

infra.yml can deploy INFRA independently from PGSQL. Nginx, DNSMasq, Prometheus, AlertManager, Grafana, and Loki are controlled by their documented *_enabled parameters, allowing Pigsty to reuse or coexist with existing infrastructure.

Best Practices

  • Control metric cardinality and set retention according to available disk.
  • Back up Grafana configuration and keep alert notification channels tested.
  • Protect monitoring endpoints with access controls and HTTPS when exposed outside the trusted network.
  • Monitor the monitoring stack itself and review storage growth regularly.

Limitations & Considerations

Prometheus and Loki in v3.7 are single-node services by default. Very large metric cardinality, long retention, or complex dashboards require capacity planning. External long-term storage and HA monitoring architectures are manual integrations rather than built-in v3.7 modules.