Version v3.7.0 of the documentation is no longer actively maintained. The site that you are currently viewing is an archived snapshot. For up-to-date documentation, see the latest version.
Monitor
Overview
Pigsty uses the modern observability stack for PostgreSQL monitoring:
- Grafana for metrics visualization and PostgreSQL datasource.
- Prometheus for PostgreSQL / Pgbouncer / Patroni / HAProxy / Node metrics
- Loki for PostgreSQL / Pgbouncer / Patroni / pgBackRest logs
- Battery-Include dashboards for PostgreSQL and everything else
Metrics
PostgreSQL’s metrics are defined by collector files: pg_exporter.yml. Prometheus record rules and alert evaluation will further process it: files/prometheus/rules/pgsql.yml
There are three identity labels: cls, ins, ip, which will be attached to all metrics & logs. node & haproxy will try to reuse the same identity to provide consistent metrics & logs.
Logs
PostgreSQL-related logs are collected by promtail and sent to Loki on infra nodes by default.
pg_log_dir: postgres log dir,/pg/log/postgresby defaultpgbouncer_log_dir: pgbouncer log dir,/pg/log/pgbouncerby defaultpatroni_log_dir: patroni log dir,/pg/log/patroniby defaultpgbackrest_log_dir: pgbackrest log dir,/pg/log/pgbackrestby default
Targets
Prometheus monitoring targets are defined in static files under /etc/prometheus/targets/pgsql/. Each instance will have a corresponding file. Take pg-meta-1 as an example:
When the global flag patroni_ssl_enabled is set, the patroni target will be managed as /etc/prometheus/targets/patroni/<ins>.yml because it requires a different scrape endpoint (https).
Prometheus monitoring target will be removed when a cluster is removed by bin/pgsql-rm or pgsql-rm.yml. You can use playbook subtasks, or remove them manually:
Remote RDS targets are managed as /etc/prometheus/targets/pgrds/<cls>.yml. It will be created by the pgsql-monitor.yml playbook or bin/pgmon-add script.
Monitor Mode
There are three ways to monitor PostgreSQL instances in Pigsty:
| Item \ Level | L1 | L2 | L3 |
|---|---|---|---|
| Name | Remote Database Service | Existing Deployment | Fully Managed Deployment |
| Abbr | RDS | MANAGED | FULL |
| Scenes | connect string URL only | ssh-sudo-able | Instances created by Pigsty |
| PGCAT Functionality | ✅ Full Availability | ✅ Full Availability | ✅ Full Availability |
| PGSQL Functionality | ✅ PG metrics only | ✅ PG and node metrics | ✅ Full Support |
| Connection Pool Metrics | ❌ Not available | ⚠️ Optional | ✅ Pre-Configured |
| Load Balancer Metrics | ❌ Not available | ⚠️ Optional | ✅ Pre-Configured |
| PGLOG Functionality | ❌ Not Available | ⚠️ Optional | ⚠️ Optional |
| PG Exporter | ⚠️ On infra nodes | ✅ On DB nodes | ✅ On DB nodes |
| Node Exporter | ❌ Not Deployed | ✅ On DB nodes | ✅ On DB nodes |
| Intrusion into DB nodes | ✅ Non-Intrusive | ⚠️ Installing Exporter | ⚠️ Fully Managed by Pigsty |
| Instance Already Exists | ✅ Yes | ✅ Yes | ⚠️ Created by Pigsty |
| Monitoring users and views | ⚠️Manually Setup | ⚠️Manually Setup | ✅ Auto configured |
| Deployment Usage Playbook | bin/pgmon-add <cls> |
subtasks of pgsql.ym/node.yml |
pgsql.yml |
| Required Privileges | connectable PGURL from infra nodes | DB node ssh and sudo privileges | DB node ssh and sudo privileges |
| Function Overview | PGCAT + PGRDS | Most Functionality | Full Functionality |
Monitor Existing Cluster
Suppose the target DB node can be managed by Pigsty (accessible via ssh and sudo is available). In that case, you can use the pg_exporter task in the pgsql.yml playbook to deploy the monitoring component PG Exporter on the target node in the same manner as a standard deployment.
You can also deploy the connection pool and its monitoring on existing instance nodes using the pgbouncer and pgbouncer_exporter tasks from the same playbook. Additionally, you can deploy host monitoring, load balancing, and log collection components using the node_exporter, haproxy, and promtail tasks from the node.yml playbook, achieving a similar user experience with the native Pigsty cluster.
The definition method for existing clusters is very similar to the normal clusters managed by Pigsty. Selectively run certain tasks from the pgsql.yml playbook instead of running the entire playbook.
Since the target database cluster already exists, you must manually setup monitoring users, schemas, and extensions on the target database cluster.
Monitor RDS
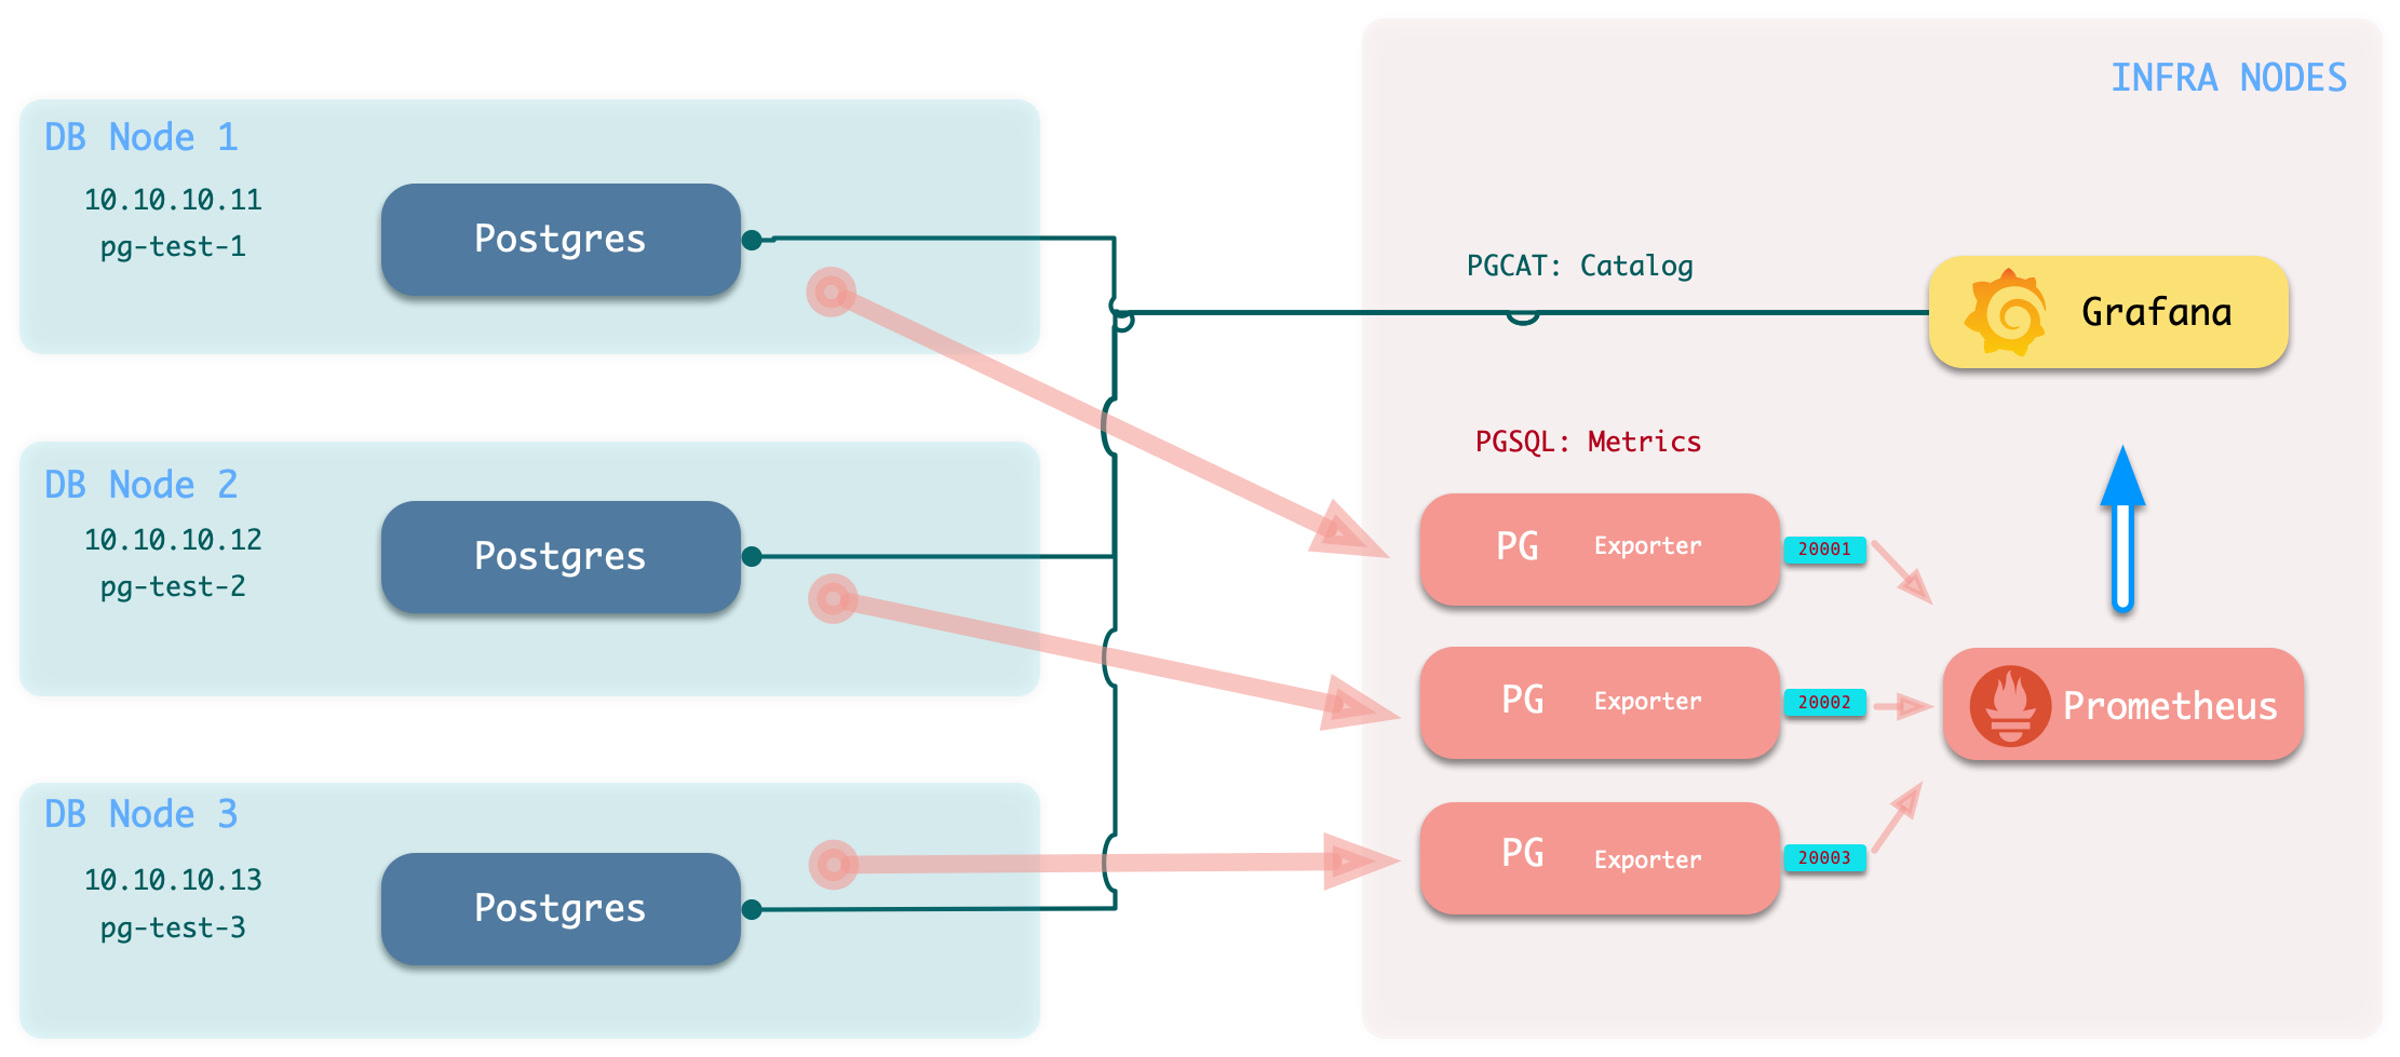
If you can only access the target database via PGURL (database connection string), you can refer to the instructions here for configuration. In this mode, Pigsty deploys the corresponding PG Exporter on the INFRA node to fetch metrics from the remote database, as shown below:
The monitoring system will no longer have host/pooler/load balancer metrics. But the PostgreSQL metrics & catalog info are still available. Pigsty has two dedicated dashboards for that: PGRDS Cluster and PGRDS Instance. Overview and Database level dashboards are reused. Since Pigsty cannot manage your RDS, you have to setup monitor on the target database in advance.
Below, we use a sandbox environment as an example: now we assume that the pg-meta cluster is an RDS instance pg-foo-1 to be monitored, and the pg-test cluster is an RDS cluster pg-bar to be monitored:
-
Create monitoring schemas, users, and permissions on the target. Refer to Monitor Setup for details.
-
Declare the cluster in the configuration list. For example, suppose we want to monitor the “remote”
pg-meta&pg-testclusters:
The databases listed in the pg_databases field will be registered in Grafana as a PostgreSQL data source, providing data support for the PGCAT monitoring panel. If you don’t want to use PGCAT and register the database in Grafana, set pg_databases to an empty array or leave it blank.
- Execute the command to add monitoring:
bin/pgmon-add <clsname>
- To remove a remote cluster from monitoring, use
bin/pgmon-rm <clsname>
You can use more parameters to override the default pg_exporter options. Here is an example for monitoring Aliyun RDS and PolarDB with Pigsty:
Monitor Setup
When you want to monitor existing instances, whether it’s RDS or a self-built PostgreSQL instance, you need to make some configurations on the target database so that Pigsty can access them.
To bring an external existing PostgreSQL instance into monitoring, you need a connection string that can access that instance/cluster. Any accessible connection string (business user, superuser) can be used, but we recommend using a dedicated monitoring user to avoid permission leaks.
- Monitor User: The default username used is
dbuser_monitor. This user belongs to thepg_monitorgroup, or ensure it has the necessary view permissions. - Monitor HBA: Default password is
DBUser.Monitor. You need to ensure that the HBA policy allows the monitoring user to access the database from the infra nodes. - Monitor Schema: It’s optional but recommended to create a dedicate schema
monitorfor monitoring views and extensions. - Monitor Extension: It is strongly recommended to enable the built-in extension
pg_stat_statements. - Monitor View: Monitoring views are optional but can provide additional metrics. Which is recommended.
Monitor User
Create a monitor user on the target database cluster. For example, dbuser_monitor is used by default in Pigsty.
The monitor user here should have consistent pg_monitor_username and pg_monitor_password with Pigsty config inventory.
Monitor HBA
You also need to configure pg_hba.conf to allow monitoring user access from infra/admin nodes.
If your RDS does not support the RAW HBA format, add admin/infra node IP to the whitelist.
Monitor Schema
Monitor schema is optional, but we strongly recommend creating one.
Monitor Extension
Monitor extension is optional, but we strongly recommend enabling pg_stat_statements extension.
Note that this extension must be listed in shared_preload_libraries to take effect, and changing this parameter requires a database restart.
You should create this extension inside the admin database: postgres. If your RDS does not grant CREATE on the database postgres. You can create that extension in the default public schema:
As long as your monitor user can access pg_stat_statements view without schema qualification, it should be fine.
Monitor View
It’s recommended to create the monitor views in all databases that need to be monitored.
Monitor Schema & View Definition